
The Industrial Revolution was just catch-up growth
The Industrial Revolution was just catch-up growth
The mystery of why growth has been so fast from early 19th century up to the late 20th century is that living standards in the early 19th century were far below potential

Edited: September 30
One common topic of discussion is the idea that the Ancient World (i.e., the Mediterranean world of classical antiquity) failed to achieve an “industrial revolution,” and there is substantial discussion among historians and economists about why it failed. However, the state of empirical evidence shows that it is not the actual puzzle. Instead, from a macro-historical perspective, the empirical evidence points to the inverse direction: the puzzle is not why the ancient world did not grow, it is why living standards in Europe around the year 1800 were so low, which implies that the massive growth after 1800 (the “industrial revolution”) was natural catch-up growth.
The current state of empirical evidence shows that previous civilizations could be much more effective in realizing their economic potential than Europe at the turn of the 19th century. Therefore, from a super-long-run multi-civilizational perspective, the growth following 1800 was just Europe and its colonies realizing their dormant economic potential.
Economists use the term catch-up growth to mean the convergence in living standards between developing countries and developed countries. A country like China, which was extremely poor in 1980, could develop at extremely fast rates just by integrating itself into the world economy and assimilating foreign technology and business practices. Similarly, Europe, beginning in 1800, could grow faster than any previous ancient civilization because it was so poor while having access to greater accumulated knowledge and technology and a much greater demographic size.
The state of empirical evidence suggests that living standards in pre-modern societies could be substantially higher than in Europe in 1800
I know of quantitative evidence regarding economic performance mostly along five dimensions: (1) Urbanization. (2) Wages in terms of food calories. (3) Standards of housing. (4) Biological standard of living, (5) Volume of long-distance trade. Let us review those:
Urbanization
As I argued in previous posts, there is a strong correlation between economic development and the rate of urbanization.

Europe in 1800 had an urbanization rate of 15% in terms of the proportion of the population living in towns and cities larger than 2,000 inhabitants, according to Bairoch and Goertz (1986). This rate of urbanization, although low by modern standards, was higher than in the rest of the world: it was about twice as high as the rate of urbanization in 18th-19th century China, estimated to fluctuate around 7 to 8%, according to Xu et al. (2019).
However, previous civilizations attained much higher urbanization rates than Europe at the turn of the 19th century. Based on Hansen (2006), I estimate that in the Late Classical Greek civilization, between 50 and 60% of the total population resided in towns larger than 2,000 inhabitants (the point estimate is 54%). In terms of population residing in towns over 5,000 inhabitants, the fraction was 11% in Europe in 1800 (Bairoch and Goertz 1986) to 32-33% in the Late Classical Greek world (Ober 2015). Roman-era Italy was also much more urbanized than early 19th-century Europe, with perhaps 35% to 40% of its population living in towns with over 2,000 inhabitants. Other city-state cultures, such as Bronze Age Mesopotamia, were also highly urbanized. In the case of Mesopotamia, it is estimated by archeologists that, like in Classical Greece, most people typically lived in towns and cities (Hansen 2008).
While one might argue that certain parts of Europe at the turn of the 19th century were much more urbanized than 15%, like the Netherlands (around 40%), that same argument can be applied to certain parts of the Ancient Greek world: Athens in ca. 400-350 BC constituted a larger proportion of the population of the Ancient Greek world than the Netherlands in respect to Europe in ca. 1800, and during the Peloponnesian War, Athens’ rate of urbanization reached 100% for several years after following the suggestion of Pericles, the Athenians decided to evacuate their entire rural population inside their city-walls and the city-state operated for years entirely on imported food.
Food Wages
Wages, in terms of calories of grain that could be purchased, were higher in Europe than in Asia in 1800, and English wages were higher than the European average (European and Japanese wages from Clark 2007, Indian and Chinese wages from Broadberry and Gupta 2006).
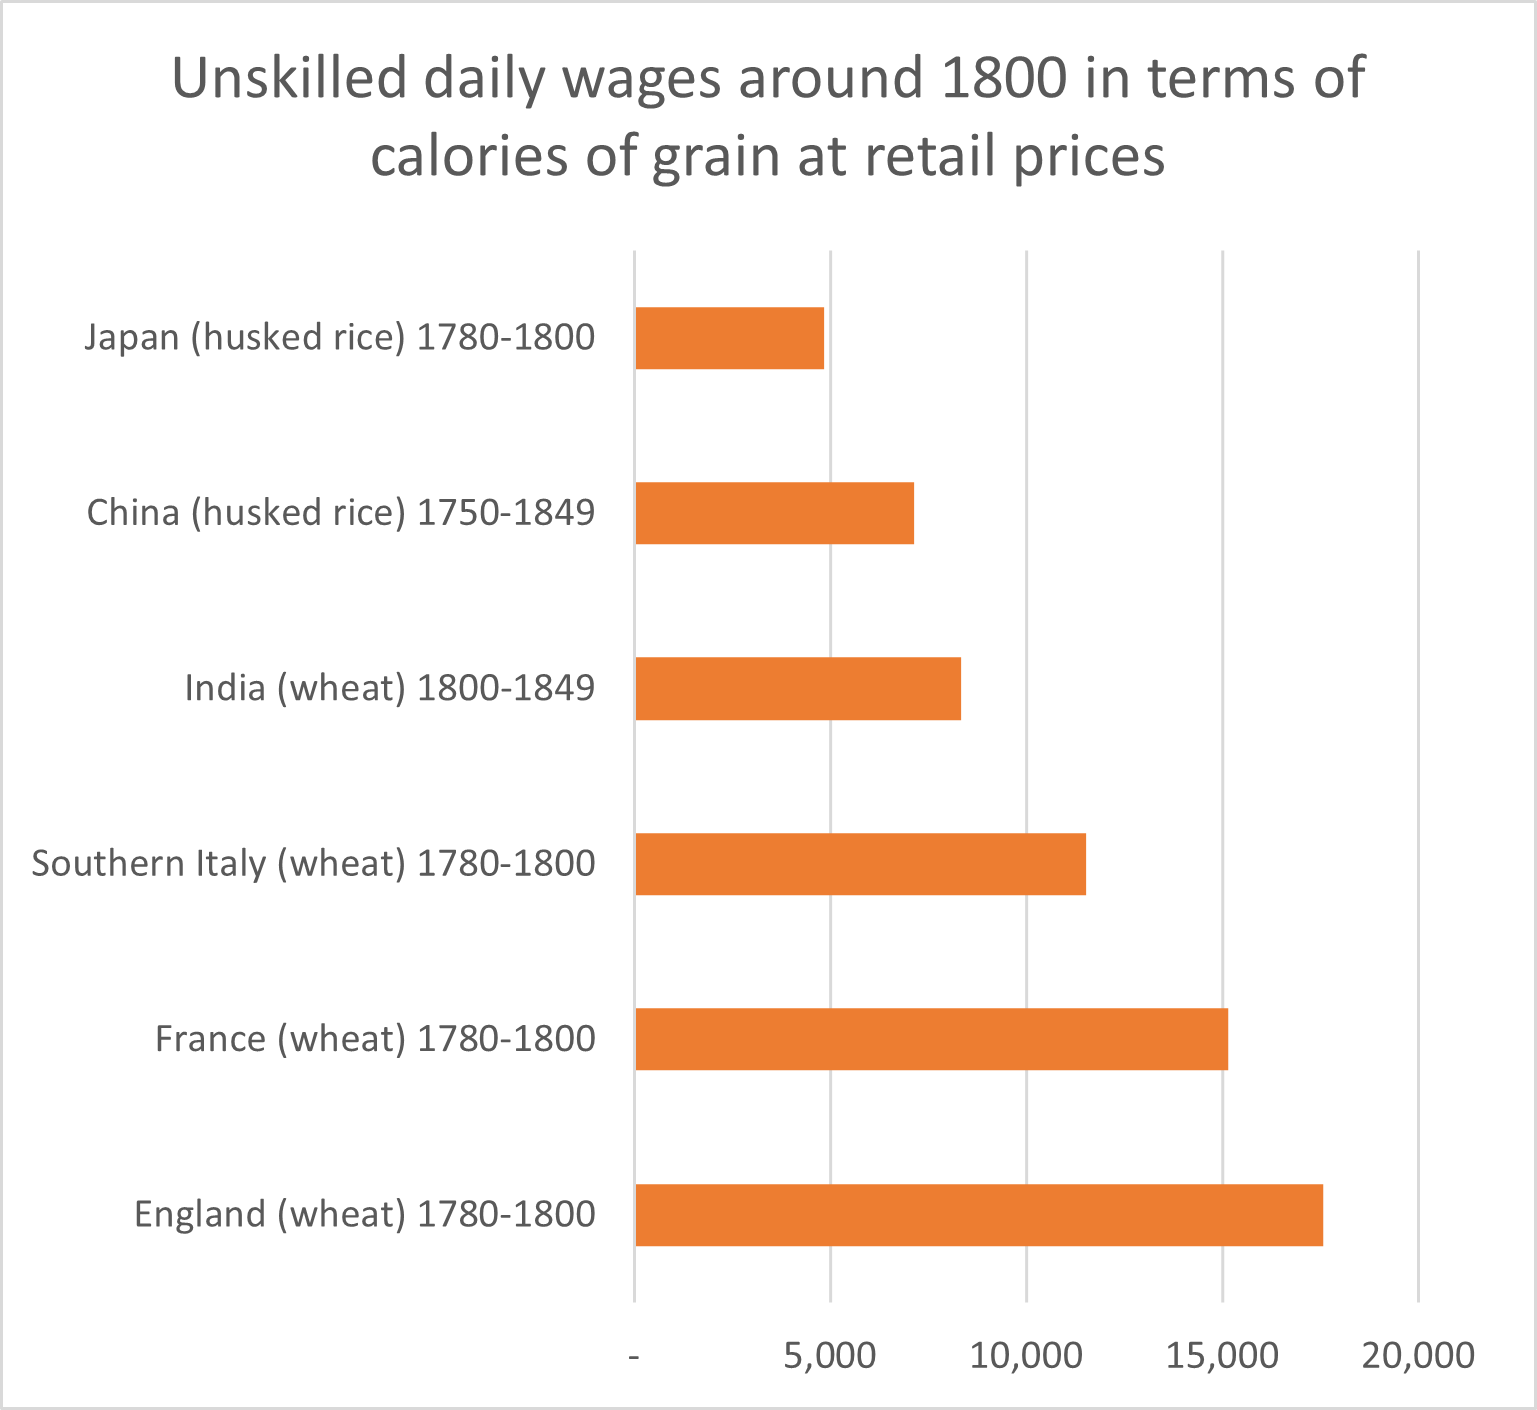
However, the differences were modest: English unskilled wages were 2-2.5 times higher than in Asia and only about 50% higher than in Southern Italy. For skilled workers, the difference was smaller since the skill premium was a bit higher an Asia.
The state of evidence shows that wages in Classical Greece, Renaissance Italy, and even Bronze Age Mesopotamia were substantially higher than in Europe in 1800.
Morris (2014) states unskilled wages in Late Classical Athens were 33,000 to 40,000 calories of wheat, 2 to 2.5 times the English wages of 1800 (ca. 17,000 calories). However, this comparison underestimates Athenian purchasing power since Athens was a massive importer of wheat, by some estimates, 80% of grain consumed was imported from foreign sources (Bresson 2016). Hence, wheat prices were higher in Athens than the average in the classical world.
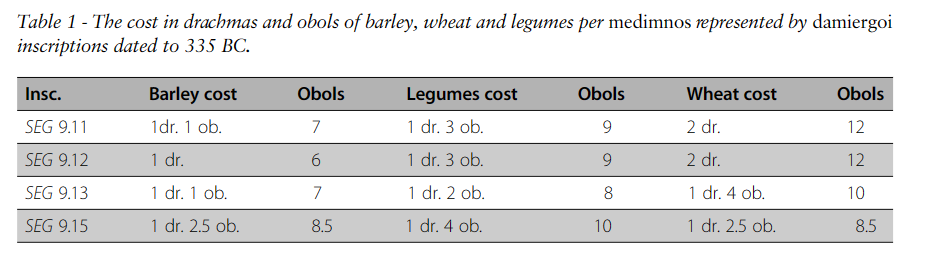
The wheat prices in the city of Cyrene in North Africa, a major wheat exporter (also the city where Eratosthenes was born), were three times lower than in Athens (inscriptions show prices of 8.5 to 12 obols per 52 liter measure compared to 30-36 obols in Athens, Abdelhamed 2018). Athenian unskilled wages in the 4th century BC were nine obols a day (Ober 2015), and skilled wages tended to be around 12 to 15 obols daily (Hansen 1999). We lack data on the daily unskilled wages of Cyrene. Still, there is no evidence that Athenian wages were substantially higher than typical across the Late Classical world. Athenian soldiers and trireme crews were paid about the same as Alexander and his successors’ armies. Alexander paid his footsoldiers 240 obols a month, and his successors (the Diadochi) typically paid footsoldiers between 6 to 9 obols a day (Taylor 2020). At the same time, cavalry were typically paid three times the rate of foot soldiers. If we conservatively assume Cyrenean unskilled wages were one-third lower than in Athens, six obols a day, then an unskilled Cyrenean worker made ca. 75,000 calories of wheat a day, 4 to 5 times French and British wheat wages around 1800 and about ten times level the China and India.
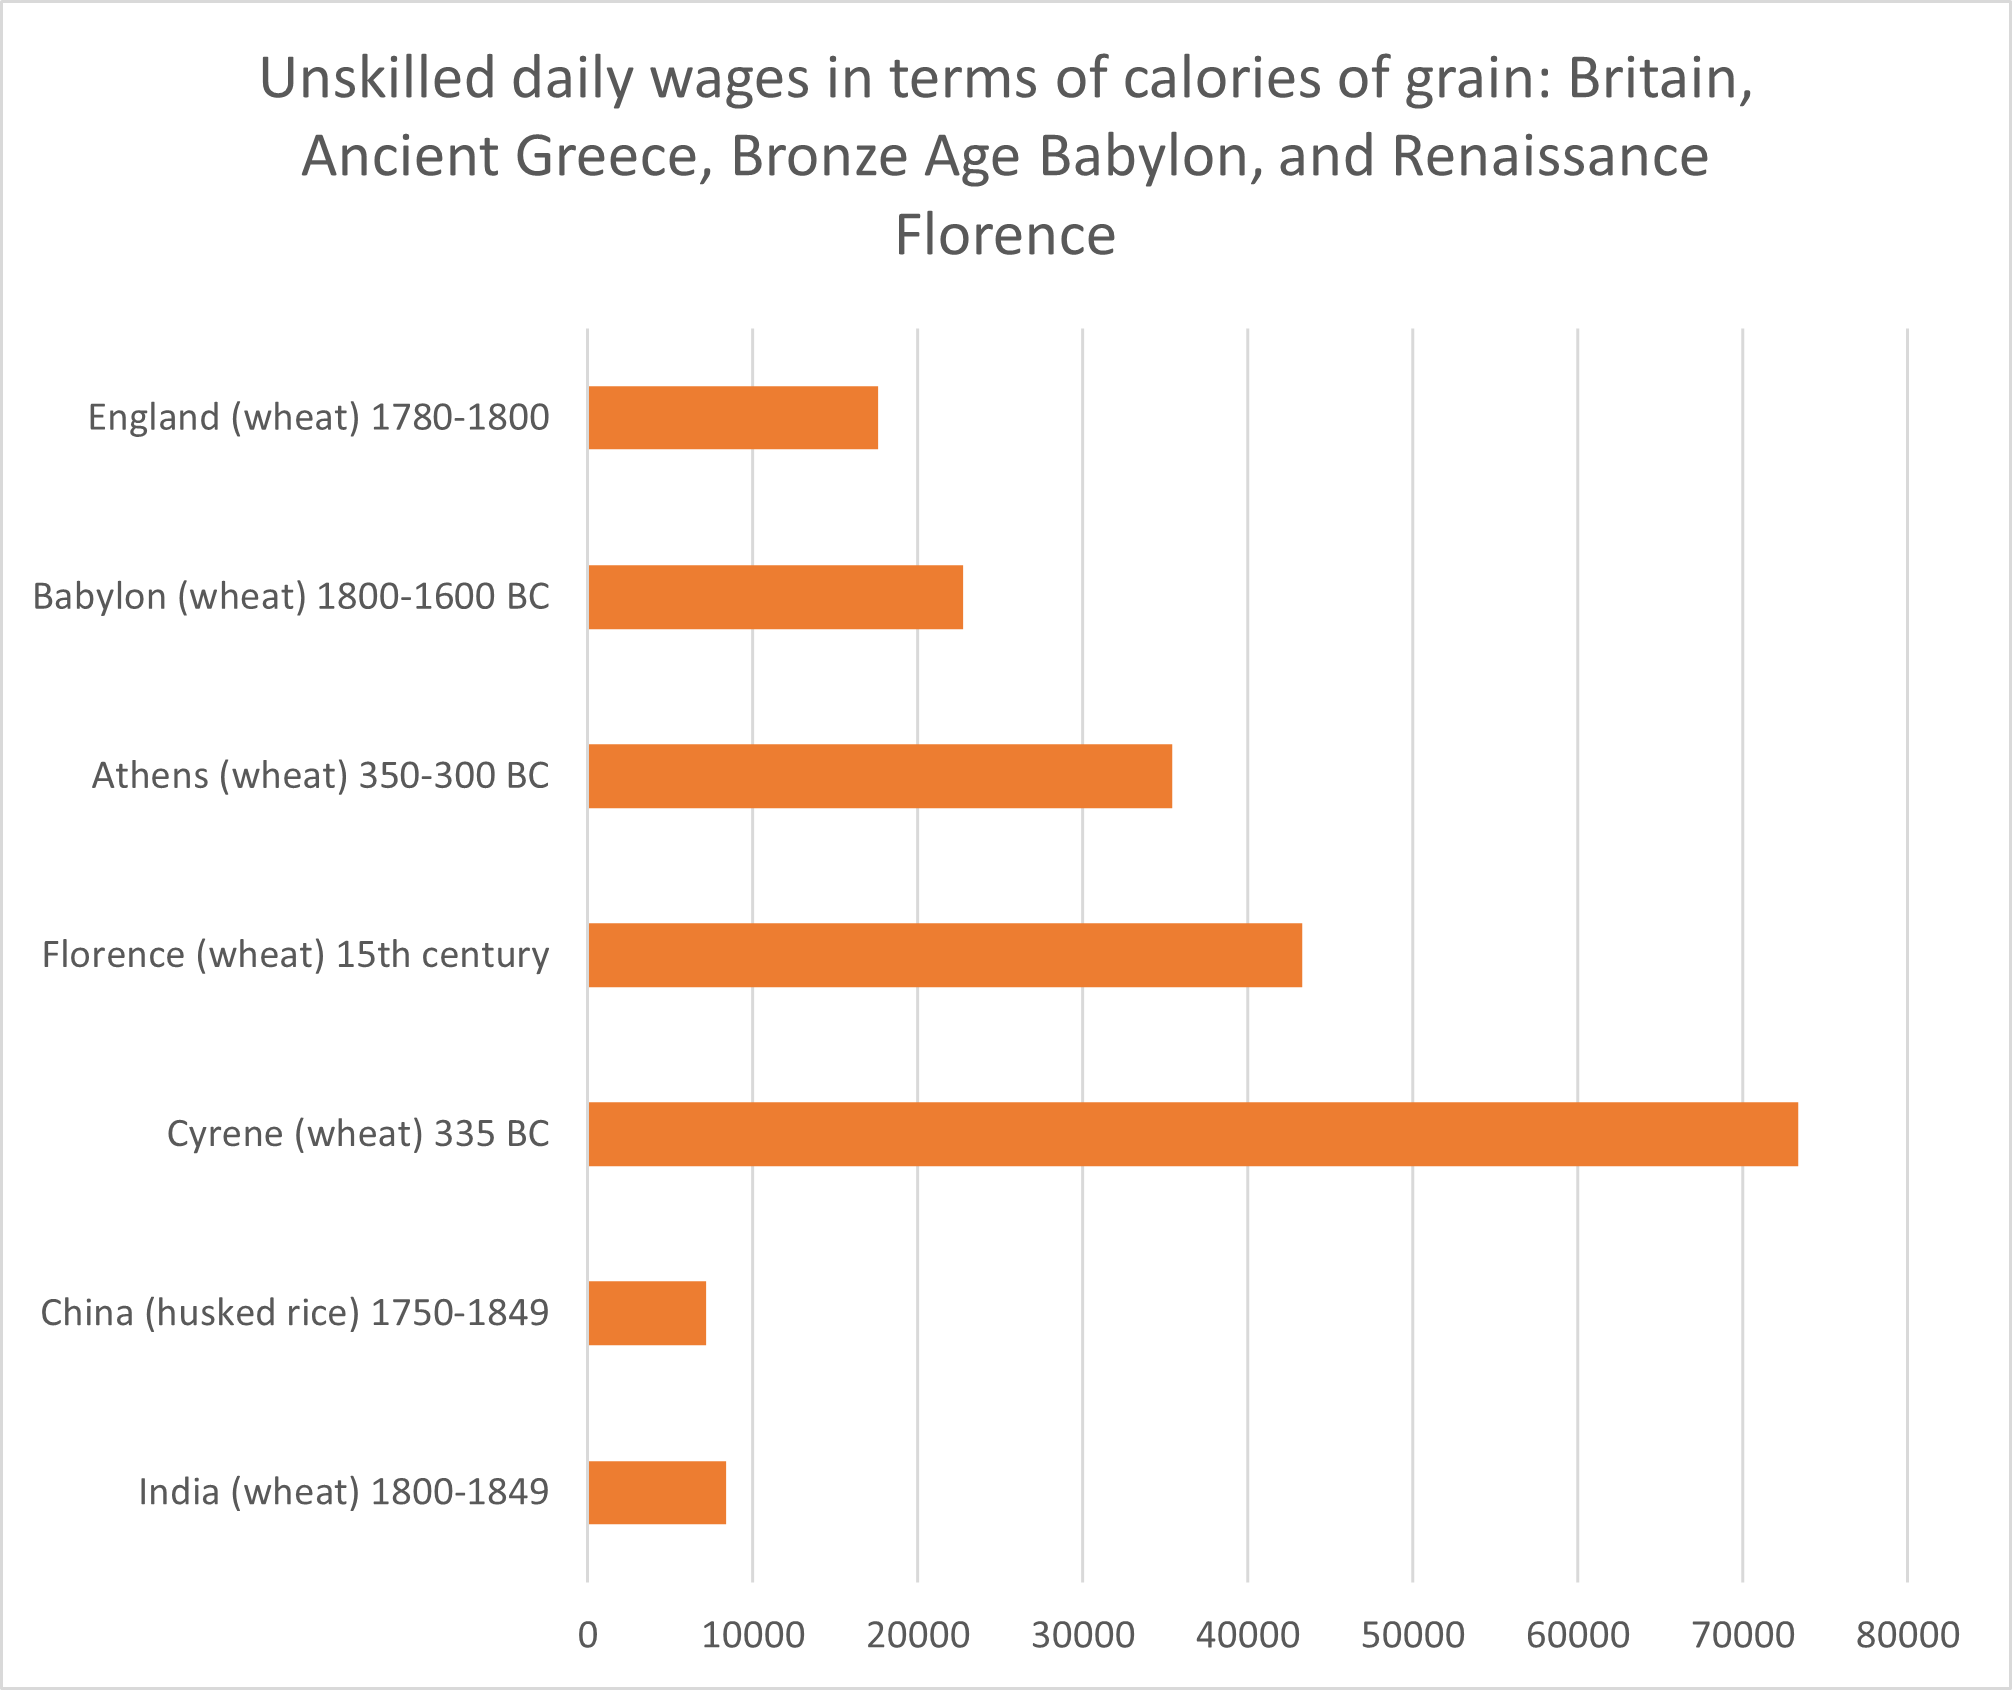
Even Babylonian wages from the 18th and 17th centuries BC were higher than European and Asia wages in the early 19th century (Clarke 2007). Roughly 30% higher than English and 50% higher than French wages, and several times higher than wages in Asia.
Renaissance Florence during the 15th century also had typical daily wages much higher than in ca. 1800 France and Britain, at roughly 40,000 to 45,000 calories of wheat (Goldthwaite 1980, for unskilled construction workers), slightly higher than unskilled wages in Late Classical Athens. The Republic of Florence was one of the richest places in the world in the 15th century. Florentine real wages in terms of calories of grain were likely higher than anywhere in Europe or Asia in the early 19th century (from the set of places listed in Clark 2007, the highest grain wage in ca. 1800 was in Amsterdam at 31,000 calories).
To give a sense of perspective, it might be useful to compare these wages with current American wages. Unskilled wages are listed at ca. 17 dollars per hour at an 8-hour workday, which means 136 dollars per day. That’s enough to buy 220,000 calories of (milled) rice at retail prices, according to the Bureau of Labor Statistics. However, American workers receive other labor compensation besides their pay, such as health insurance and social security, making total labor compensation closer to around 280,000 rice calories. Therefore, US grain wages today are 3 to 8 times Classical Greek calorific wages, but those, in turn, were 2 to 6 times higher than English calorific wages at the turn of the 19th century.
Housing standards
Let's analyze the empirical evidence provided by archeology on the distribution of house sizes excavated on two of the most studied ancient Greek sites, the towns of Olynthus and Priene, compared to a British housing survey of 1831. These three samples have the following distribution of house sizes:
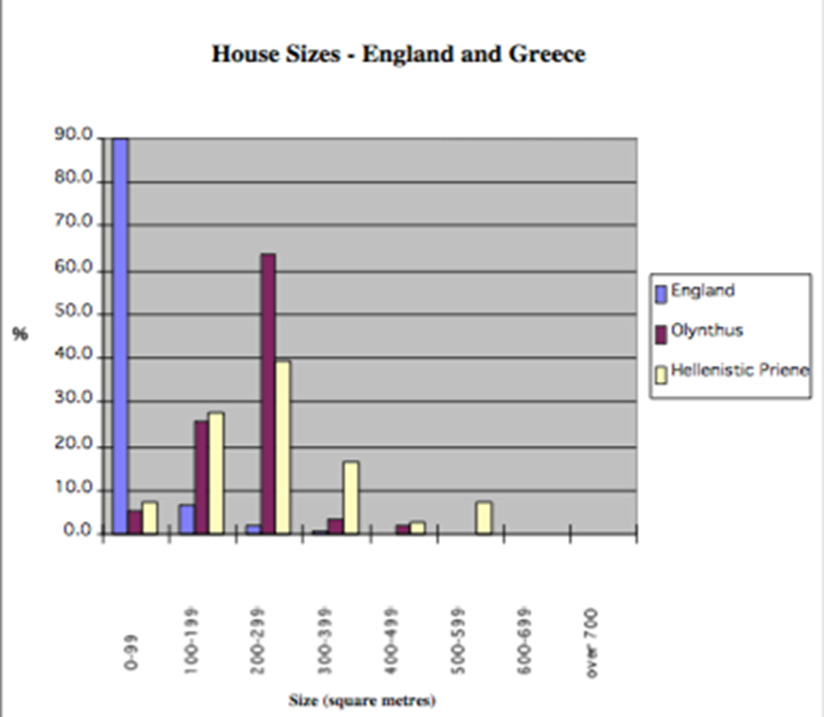
The median first-floor size among the ca. 150 houses found in these Greek sites from ca. 300 BC was ca. 190-200 square meters with 7-9 rooms on the first floor; for comparison, the median house size in England in 1831 was 21 square meters with 1-2 rooms, comparable in size to Greek houses found by archeologists dated from around 800 BC. Roughly 90% of British homes from 1831 were smaller than 100 square meters, and 78% were smaller than 40 square meters, by contrast, over 90% of the houses from Olynthus and Priene were larger than 100 square meters in regards to the area of the first floor alone (and Morris 2004 estimates that half of Late Classical Greek houses had a second floor).

One might argue that our archeological sample data on ancient house sizes is likely biased toward larger, more affluent houses. That might be because archeologists tend to focus on excavating the largest houses, which were more interesting in terms of findings (which makes the median 4th century BC Greek house 240 sq meters in Morris’ 2004 sample). However, the general consistency in median size (175-250 square meters) across dozens of archeological sites and hundreds of excavated houses strongly suggests typical Late Classical and Hellenistic Greek housing standards cannot have been substantially smaller than 200 sq meters. Also, transaction inscriptions for these large houses are consistent with such houses being affordable to the average Ancient Greek: most transaction inscriptions show prices from 1,500 drachmas to 2,500 drachmas (1 drachma = 6 obols), corresponding to 4 to 6 years of earnings of an unskilled Athenian working five days a week.
Finally, Hansen’s (2006) estimate of a population of 8 to 10 million Greeks in ca. 300 BC is based on the assumption of 200 m^2 median house size (and a mean household size of 5 to 6 people). If you decrease the median house size below the size suggested by the archeological evidence, this increases the estimated population density and the degree of urbanization to even higher levels.
Biological standard of living
The better nutrition, the taller people grow. Most of the difference in heights across countries is due to different nutritional standards rather than genetic differences. In early 19th century Europe, average adult male heights were around 160 cm, as low as in Pakistan today. Europeans were taller in the Early Middle Ages, as population density was an order of magnitude lower than in the 19th century. Hence, their diets were more based on animal products rather than grains.
Skeletons surveyed from Early Hellenistic Greece, more broadly, suggest average adult male heights of around 171.5-172 cm (roughly comparable to Early Medieval Northern European heights), and skeletons from Roman Italy suggest average adult male heights of 168-168.5 cm (Kron 2005). Compared to Italian male heights, the figure below shows that only the Italian men born after the late 1950s grew to be taller than the Hellenistic Greeks.
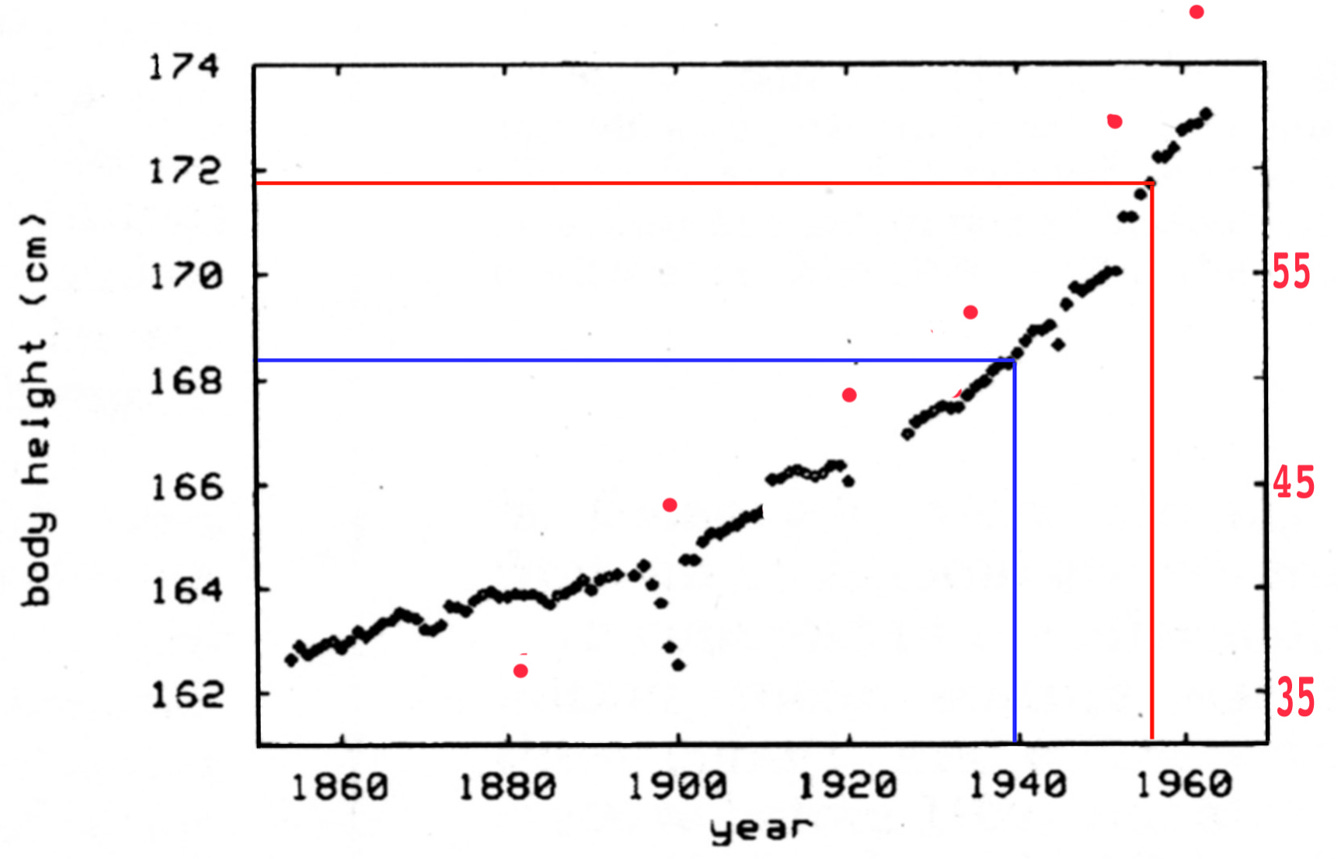
This is remarkable because, unlike 9-10th century Europe, which had 25-30 million people distributed over nearly 10 million square kilometers, the Greek world in ca. 300 BC had a population density of 40-50 people per square kilometer and around 100 people per square kilometer in densely populated regions such as the regions where major cities such as Athens, Thebes, Corinth, Argos, etc., were located. Thus, despite living in densely populated environments, thanks to massive quantities of imported food from North Africa and the Black Sea, the Early Hellenistic Greeks grew much taller than 19th-century Europeans. Thus, it is evidence of a highly developed economy.
Long-distance trade
We lack accurate national account data for any pre-modern society: modern GDP series began to be estimated in the 1930s and 1940s, and today, most countries only have GDP series constructed with modern methodology beginning in the 1980s and 1990s. However, we have more data regarding external trade volumes because governments often taxed it.
The United Kingdom over the 1770s had total exports+imports of goods typically worth 35-40 million pounds (from the Bank of England). According to Broadberry and Gupta (2006), 1.2 grams of silver per kg was the price laborers paid for wheat in Southern England in the second half of the 18th century, which means a pound brought 90 kg of wheat. Thus, the UK’s trade volume in the 1770s was 3.2 to 3.6 million tons of wheat, or 0.35 to 0.40 tons of wheat per capita, considering that the UK’s population was ca. 9 million in 1775.
We also have some statistics in regard to the volume of long-distance trade in antiquity. That’s from evidence on the tax revenues in certain situations: during the Peloponnesian War, Athens enacted a 5% tax on sea trade of the Delian League volume to pay for the costs of the war, given its expected revenues it implies an estimated volume of sea trade of 180 million drachmas in 413 BC (Kron 2015). The population of the Delian League can be roughly estimated to be around 1.25 to 2.5 million (considering the league had 150 to 330 city-states and a typical Ancient Greek city-state had 5,000-6,000 inhabitants plus the population of Athens, which was about 250,000), so per capita trade volume was ca. 75 to 150 drachmas, at Cyrenean wheat prices from 335 BC, that yields a volume of sea trade of 1.6 to 3.2 tons of wheat per capita. Athenian wheat prices in the late 5th century BC were lower than in the 4th century, typically estimated at around 3 to 5 drachmas per measure of 40 kg of wheat, but they were still 2 to 2.5 times higher than 335 BC Cyrenean prices. At those prices, Delian League sea trade can be valued at 0.60 to 2.00 tons of wheat per capita.
Another helpful comparison is to Venice in 1604. The Venetians put a 6% tax on their harbor, which yielded 118,000 ducats, according to Kron (2015). This implies a total trade volume of 2 million ducats. As ducat at the time could purchase 22 kg of wheat and given that Venice had 150,000 inhabitants in 1600 (Buringh 2021), the per capita volume of sea trade was 0.30 tons of wheat, comparable to British foreign trade two centuries later.
Conclusion: The unique conditions for the Industrial Revolution
Europe and its settler colonies, by the turn of the 19th century, had reached a population of over 200 million compared to 25-30 million in the Early Middle Ages. Its size was huge, especially compared to any ancient civilization: Ancient Egypt had about 3-7 million inhabitants; Ancient Greece, about 8-10 million; Roman Italy, about 8-9 million, and even the Ancient Chinese world in ca. 250 BC when it consisted of seven kingdoms had only about 25 to 35 million inhabitants. Other pre-modern civilizations were similarly small in population: estimates for the Aztec Empire at 1500 put it around 5 million inhabitants, and a similar population is estimated for Persia during the Middle Ages or the Inca Empire also in 1500.
As more people meant the potential for more ideas, the scope for division of labor and technological complexity in European civilization in 1800 was much higher than in any previous civilization. However, as the living standards of those much smaller previous civilizations could be much better in some cases, one reaches the conclusion that Europe's dormant potential for growth in 1800 was exceptional from a macro-historical perspective.
Therefore, by shifting its institutions to ones more conducive to economic activity in the early 19th century, European civilization began harnessing this vast, dormant potential, resulting in modern economic growth.
This macrohistorical economic development model also explains the growth slowdown in recent years. That is because, after radically improving its institutions from the 18th to the 19th centuries, our civilization’s economic progress tends to slow down as it converges to its potential.
Appendix: Cyrenean 335 BC grain prices as this is not a standard source:
I've been thinking about this blogpost for the last few days. Maybe the disparity is explained by TFR. My theory is that Western economy was in the 18th century growing slower than the population resulting in stagnating standards of living despite improving technology (what Malthus noted at the end of the period).
Ancient Greece was practicing infanticide, especially of girls, and infanticide could have kept the population stagnant allowing for higher standards of living despite a low technological level. I think the importance of infanticide is often ignored because it's an unpleasant and poorly documented topic.
After 1815 economic growth became faster and after 1840's technological improvements like germ theory, anesthesia and sewage improved life even if they didn't directly improved productivity so overall standards of living improved even as TFR remained high throughout 19th century Britain.
In this scenario Greece kneecapped its future by limiting population growth leading to the situation you mentioned in your comment of their overall population being smaller than that of the West making them more vulnerable to crisis while the West ended up with both a vastly higher population and vastly higher standards of living.
Interesting as always. I'm now curious what you mean by institutions more conducive to economic activity.
The West is unique among other civilizations because it has 1000 years of growth now despite wars, plagues, climatic changes etc.